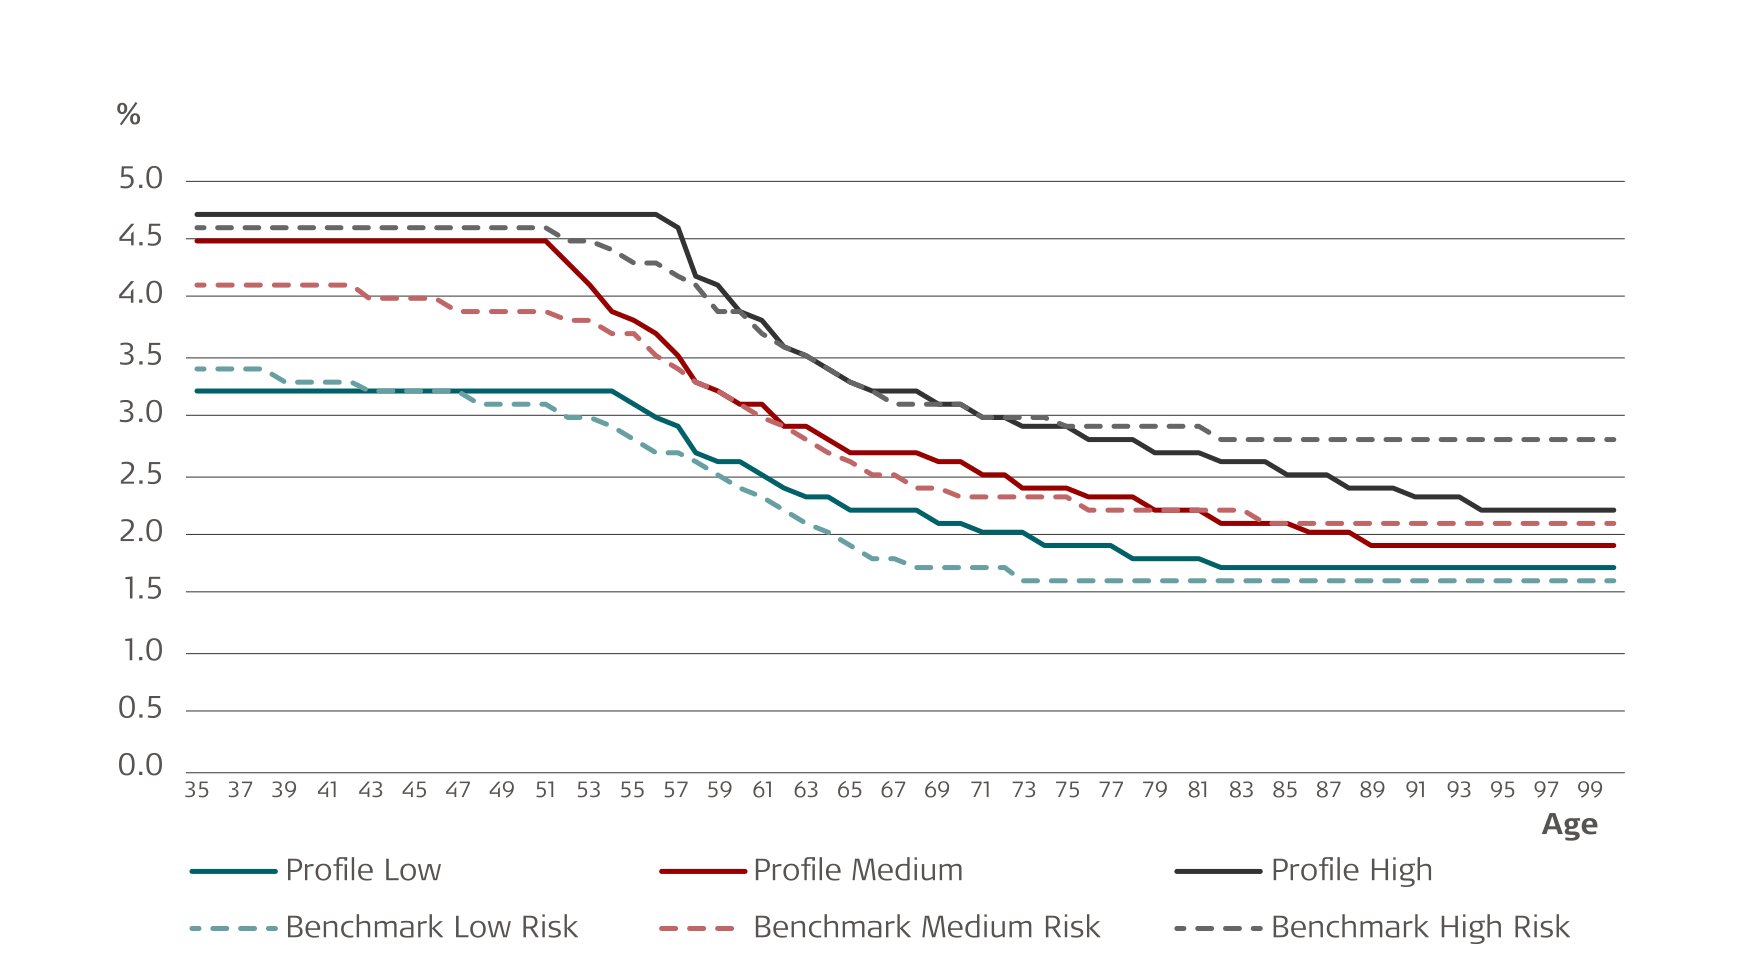
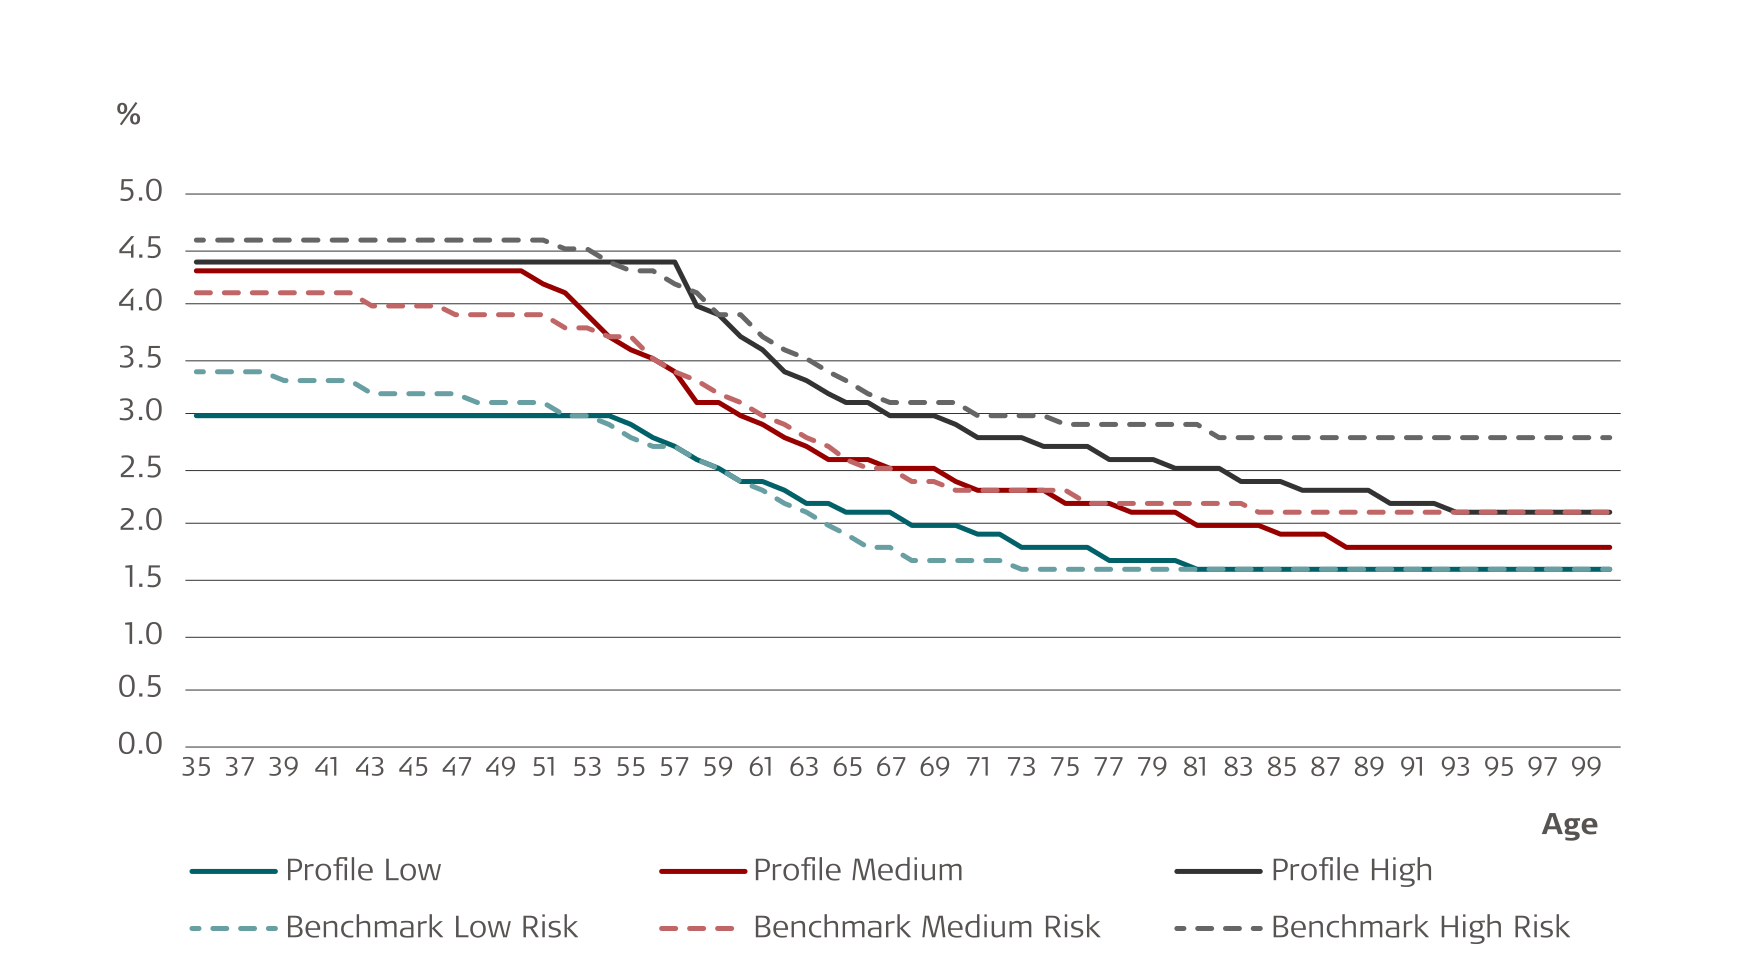
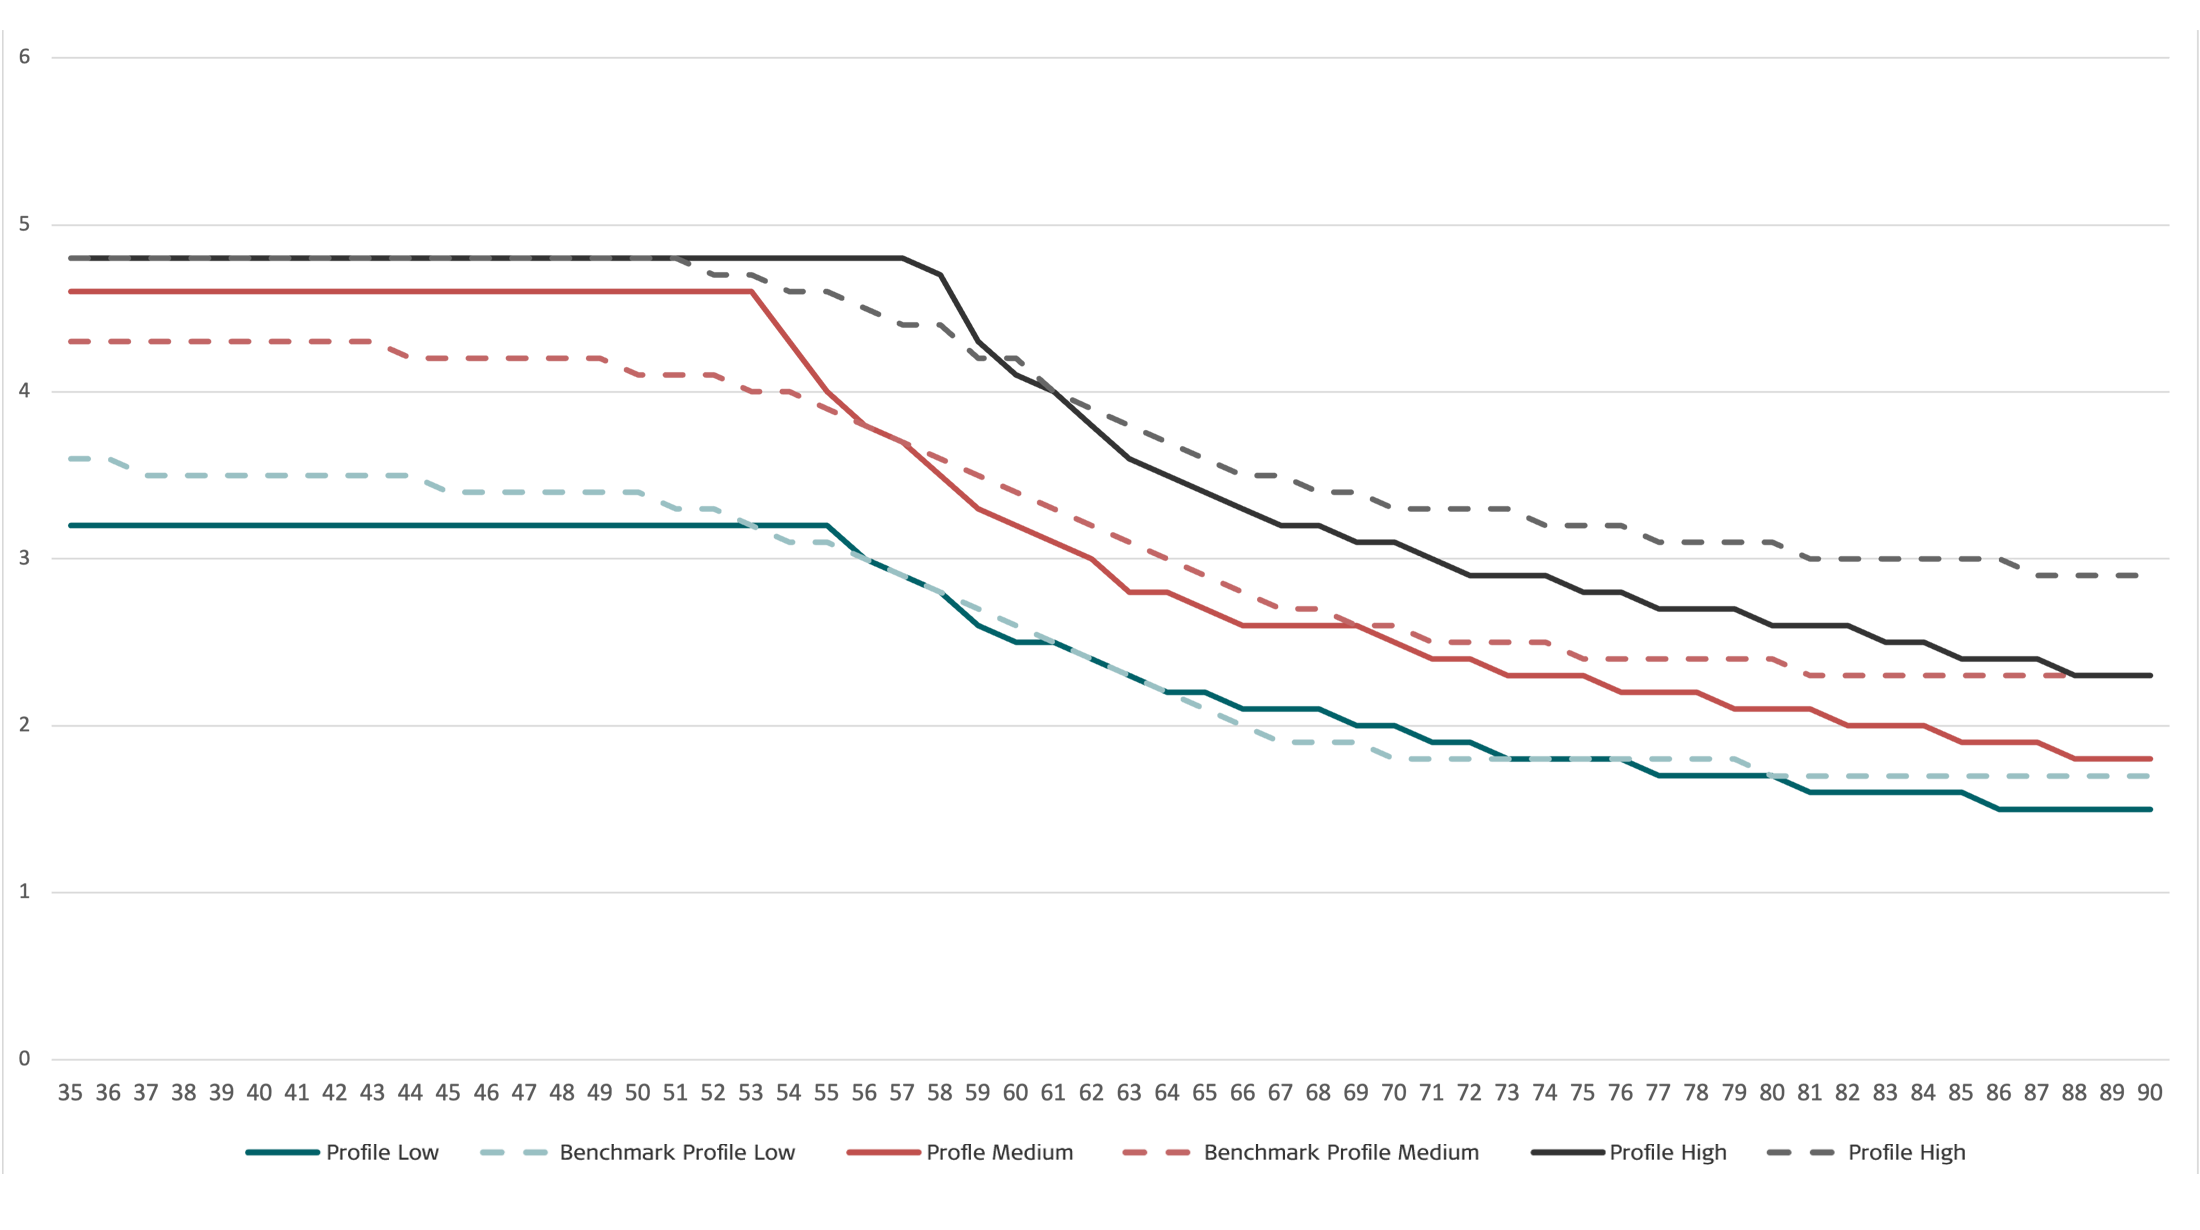
The risk in the investment profiles of PFA Pension’s lifecycle product, PFA Invests, is gradually reduced as retirement approaches, and this reduction continues after retirement.
This is illustrated in the figure and table, which shows the risk value of the three investment profiles depending on age. The retirement age is set to the standard retirement age.
The risk value is shown excluding any CustomerCapital. For savings that include CustomerCapital, the risk may vary depending on the share of the savings held in CustomerCapital. However, with a standard share in CustomerCapital of 1 %, the difference in risk is minimal.
Read more about CustomerCapital and see how much you have in CustomerCapital on Mit PFA. Then click ‘Amount of savings per concept’.
| |
Age - Before Retirement |
| Risk value |
Up to and including 45 |
46 |
47 |
48 |
49 |
50 |
51 |
52 |
53 |
54 |
55 |
56 |
57 |
58 |
59 |
60 |
61 |
62 |
63 |
64 |
65 |
66 |
67 |
68 |
69 |
70 |
| Profile Low |
3.2 |
3.2 |
3.2 |
3.2 |
3.2 |
3.2 |
3.2 |
3.2 |
3.2 |
3.2 |
3.2 |
3 |
2.9 |
2.8 |
2.6 |
2.5 |
2.5 |
2.4 |
2.3 |
2.2 |
2.2 |
2.1 |
2.1 |
2.1 |
2 |
2 |
| Profile Medium |
4.6 |
4.6 |
4.6 |
4.6 |
4.6 |
4.6 |
4.6 |
4.6 |
4.6 |
4.3 |
4 |
3.8 |
3.7 |
3.5 |
3.3 |
3.2 |
3.1 |
3 |
2.8 |
2.8 |
2.7 |
2.6 |
2.6 |
2.6 |
2.6 |
2.5 |
| Profile High |
4.8 |
4.8 |
4.8 |
4.8 |
4.8 |
4.8 |
4.8 |
4.8 |
4.8 |
4.8 |
4.8 |
4.8 |
4.8 |
4.7 |
4.3 |
4.1 |
4 |
3.8 |
3.6 |
3.5 |
3.4 |
3.3 |
3.2 |
3.2 |
3.1 |
3.1 |
| |
Age - After Retirement |
| Risk value |
71 |
72 |
73 |
74 |
75 |
76 |
77 |
78 |
79 |
80 |
81 |
82 |
83 |
84 |
85 |
86 |
87 |
88 |
89 |
90 |
91 |
92 |
93 |
94 |
95 |
96 years and beyond |
| Profile Low |
1.9 |
1.9 |
1.8 |
1.8 |
1.8 |
1.8 |
1.7 |
1.7 |
1.7 |
1.7 |
1.6 |
1.6 |
1.6 |
1.6 |
1.6 |
1.5 |
1.5 |
1.5 |
1.5 |
1.5 |
1.5 |
1.5 |
1.5 |
1.5 |
1.5 |
1.5 |
| Profile Medium |
2.4 |
2.4 |
2.3 |
2.3 |
2.3 |
2.2 |
2.2 |
2.2 |
2.1 |
2.1 |
2.1 |
2 |
2 |
2 |
1.9 |
1.9 |
1.9 |
1.8 |
1.8 |
1.8 |
1.8 |
1.8 |
1.8 |
1.8 |
1.8 |
1.8 |
| Profile High |
3 |
2.9 |
2.9 |
2.9 |
2.8 |
2.8 |
2.7 |
2.7 |
2.7 |
2.6 |
2.6 |
2.6 |
2.5 |
2.5 |
2.4 |
2.4 |
2.4 |
2.3 |
2.3 |
2.3 |
2.2 |
2.2 |
2.2 |
2.1 |
2.1 |
2.1 |
Updated 2 October 2026
Risk values between 5.0 and 6.0 represent the highest risk. Here, your savings may fluctuate significantly
from
one year to the next.
Risk values between 1.0 and 1.9 represent the lowest risk. Here, fluctuations will generally be less
pronounced.
Once you have found the risk value, you can see
here (in Danish) how much the savings may fluctuate throughout a year.
Benchmark
Insurance & Pension Denmark calculates benchmarks for respectively low, medium and high risk for display in their benchmarking tool. The Benchmarks will be recalculated every year.
Benchmark is calculated as a simple unweighted average of the risk scores. All pension companies with life cycle products are included in the calculation.
The benchmarks are included in the graph above.
Please find the method description at Insurance & Pension Denmark's website (in
Danish
only)
Profile risk classification
Based on Insurance & Pension Denmark's risk bands, the profiles are risk classified with these
classifications:
Profile Low: Low risk
Profile Medium: Medium risk
Profile High: High risk
Short-term and long-term risk
Pension savings entail two types of risk. The short-term risk illustrates how much the value of your savings
may
fluctuate during the next year. And the long-term risk illustrates the level of uncertainty related to your
future payouts when you retire.
The risk value is only an expression of the short-term risk – i.e. how much the value of your savings
may
fluctuate during the next year.
The risk depends on your age
When the risk is high, the return expectations are also high. Therefore, most pension plans entail a high
risk
while the customer is young. While the customer is young, there is time to regain any losses sustained
during
years with negative developments on the financial markets.
When the customer gets older, there is less time to regain any losses sustained. Thus, most pension plans
gradually reduce the risk as the customer gets older.