Hop til indhold

Asset allocation

Asset allocation

Asset allocation for PFA Invests

Here, you can see how PFA invests your pension savings based on your investment profile and the number of years until retirement. First, you must choose between PFA Plus, PFA Climate Plus or a combination of the two.

You then choose your investment profile, age and retirement date, after which you can view the allocations graphically and at different levels of detail.

Under ‘Detailed asset allocation’, you can see, among other things, how much is invested in equities, bonds, property and alternative investments. You can also see the strategic and actual asset allocations in the investment profiles based on the 10 asset classes defined by Insurance & Pension Denmark.

PFA Pension may adjust the allocation between the High risk and Low risk funds and the asset allocation in the underlying funds at any time and without notice.

View the asset allocation for the Cautious profile.

Data shown as at: 30 June 2026 – actual allocations, including asset allocation in the underlying funds.

31 June 2026 – strategic allocations.

PFA Flexible

Below, you can see the strategic and actual investment allocations for PFA Flexible, based on the 10 asset classes defined by Insurance & Pension Denmark.

Select the percentage allocation for the High risk and Low risk funds at the top of the table to view the allocations. You can view your actual allocation between the High risk fund and the Low risk fund on My PFA.

The strategic asset allocation reflects PFA’s overall investment strategy, which is reviewed annually. The actual asset allocation provides a snapshot of the asset allocation at the time of investment. The strategic allocations apply to 2026. The actual allocations are stated as at 31 June 2026.

PFA CustomerCapital is not included in the allocations, but for risk purposes it should be classified in the ‘Global equities’ asset class.

Read more about CustomerCapital and view your exact share in CustomerCapital on My PFA.


Asset allocation in High risk fund PFA Plus

Investment distributed by region (equity) PFA Plus High
USA 61.8 %
Europe 14.0 %
Emerging Markets 9.5 %
Rest of World 5.7 %
Japan 4.7 %
Denmark 4.3 %
Investment distributed by sector PFA Plus High
Information Technology 26.5 %
Financials 19.6 %
Industrials 11.3 %
Consumer Discretionary 10.2 %
Health Care 10.0 %
Communication Services 8.7 %
Materials 4.5 %
Consumer Staples 4.4 %
Utilities 2.8 % 
Real Estate 1.0 % 
Energy 0.9 % 
Other 0.2 % 

Asset allocation in Low risk fund PFA Plus

remaining maturity PFA Plus Low
0-3 years 38.4 %
3-5 years 23.8 %
5-7 years 9.6 %
7+ years 28.2 %

Asset allocation in High risk fund PFA Climate Plus

investment distributed by region (equity) PFA climate Plus High
USA 64.8 %
Europe 13.1 %
Emerging Markets 9.3 %
Rest of World 6.9 %
Japan 5.5 %
Denmark 0.5 %
Investment distributed by sector PFA climate Plus High
Information Technology 30.6 %
Financials 16.7 %
Communication Services 11.8 %
Industrials 10.2 %
Health Care 9.5 %
Consumer Discretionary 7.8 %
Materials 6.8 %
Real Estate 2.7 %
Consumer Staples 2.5 % 
Utilities 1.3 % 
Other 0.1 % 
Energy 0.0 % 

Asset allocation in Low risk fund PFA Climate Plus

remaining maturity PFA CLimate Plus Low
0-3 years 41.4 %
3-5 years 10.7 %
5-7 years 8.0 %
7+ years 39.9 %

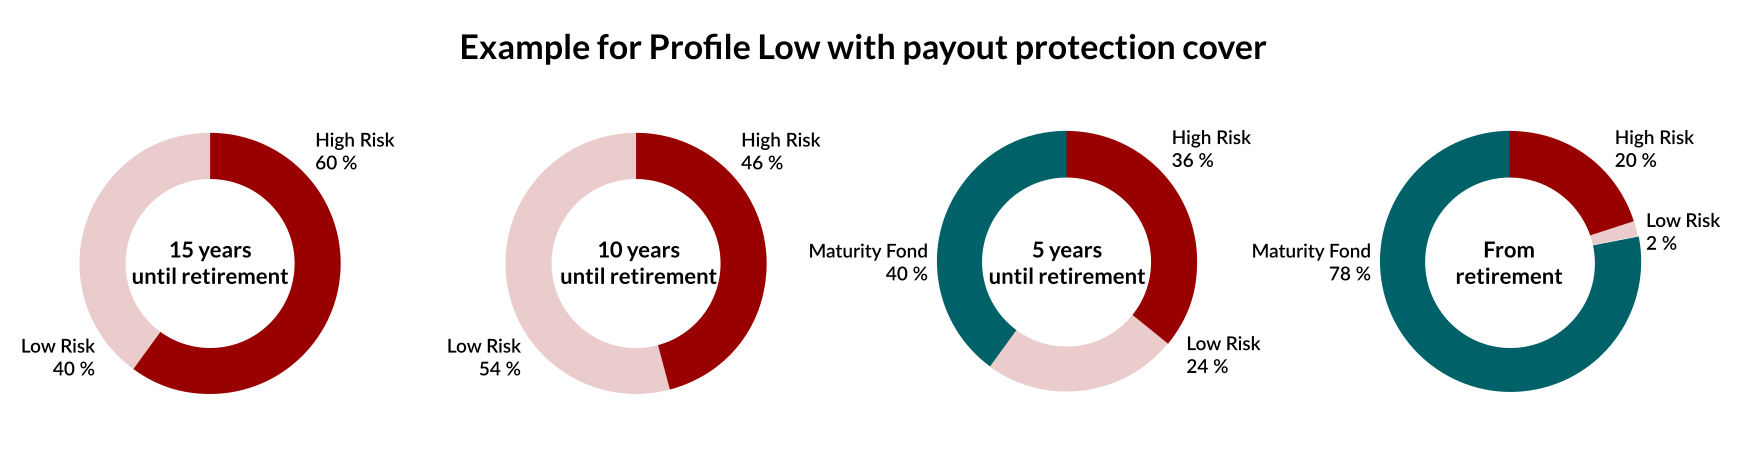
Example: Asset allocation for a customer with payout protection cover (Profile Low only)

The strategic distribution of assets reflects PFA’s overall investment strategy, which is revised annually. The actual asset allocation provides a snapshot of the asset allocation on the investment profile.

CustomerCapital is not included in the distribution, but, in terms of risk, it is placed in the asset class Global Equity. Read more about CustomerCapital and see your exact share of CustomerCapital at My PFA.


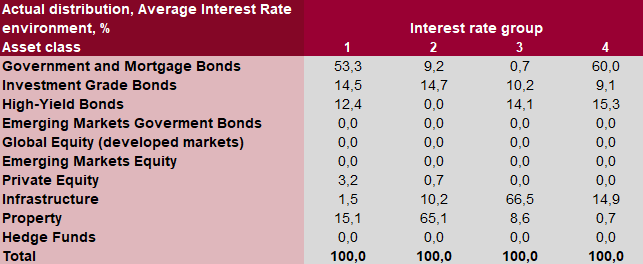
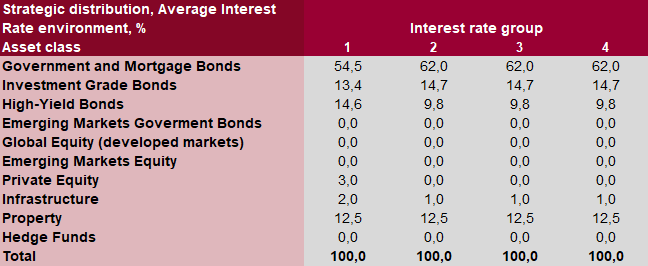
Average Interest Rate asset allocation

Below, the strategic and actual distribution of assets within the four interest rate groups in the average interest rate environment is listed. The assets are distributed among 10 asset classes fixed by Insurance & Pension Denmark.

View your interest rate group at My PFA.

The strategic distribution of assets reflects PFA’s overall investment strategy, which is revised annually. The actual asset allocation provides a snapshot of the asset allocation on the investment profile. The strategic distribution applies for 2025. The actual distribution has been calculated as at: 1 April 2025.

PFA CustomerCapital is not included in the distribution, but, in terms of risk, it is placed in the asset class Global Equity. Read more about CustomerCapital and see your exact share of CustomerCapital at My PFA.