Average Interest Rate asset allocation
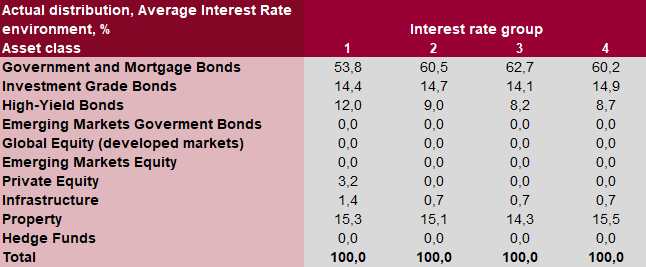
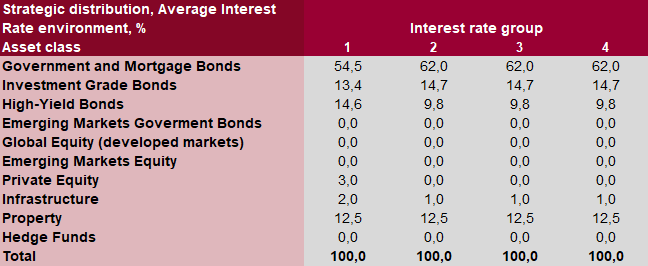
Below, the strategic and actual distribution of assets within the four interest rate groups in the average interest rate environment is listed. The assets are distributed among 10 asset classes fixed by Insurance & Pension Denmark.
View your interest rate group at My PFA.
The strategic distribution of assets reflects PFA’s overall investment strategy, which is revised annually. The actual asset allocation provides a snapshot of the asset allocation on the investment profile. The strategic distribution applies for 2025. The actual distribution has been calculated as at: 1 April 2025.
PFA CustomerCapital is not included in the distribution, but, in terms of risk, it is placed in the asset class Global Equity. Read more about
CustomerCapital and see your exact share of CustomerCapital at
My PFA.